









It started with SEO and a few ad campaigns. Six years later, I work across the full go-to-market: who to target, what to say, and the systems that turn buyer intent into pipeline. Here’s how I got here, and what I built along the way.
Every role added one more piece of the go-to-market.
I started at the front of the funnel, running campaigns. Over time I moved into buyer signals, then lifecycle, then the systems underneath it all. Along the way, I stopped waiting on ops or engineering to build what a campaign needed and started building it myself.
CHAPTER 01Digital Marketing Executive · AptyAug 2020 – Dec 2022
Learning where demand comes from.
My career began at the top of the funnel. I worked across SEO, Google Ads, and LinkedIn Ads, acting as the bridge between demand generation and the data that showed what was actually working.
Over the next two years, monthly website sessions grew about 9x, and paid search and social became a steady source of pipeline, averaging $206K in new pipeline every month.
✓SEO strategy: Planned and ran keyword research and blog content coordination to grow organic traffic. Monthly website sessions grew from 8,035 in Aug 2020 to 74,012 in Apr 2022, peaking at 116,781 in Mar 2022.
✓Paid acquisition: Managed and optimized Google Ads and LinkedIn Ads as monthly ad spend scaled from about $14K to $37.5K, generating an average of $206K in pipeline per month and peaking at $619.5K in Feb 2022.
✓Lead generation: Grew new contacts from 55 a month in Aug 2020 to an average of 165 a month from Jun 2021 to Apr 2022, peaking at 196 in Oct 2021.
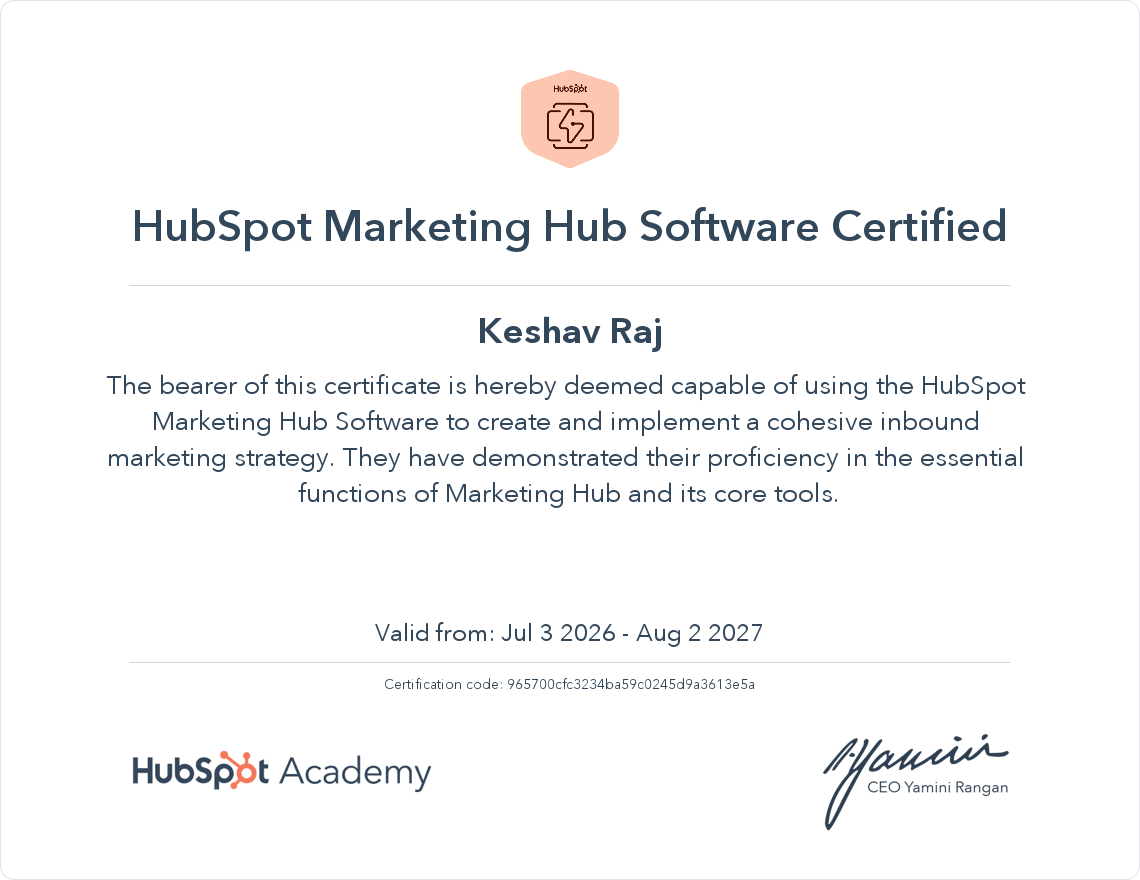
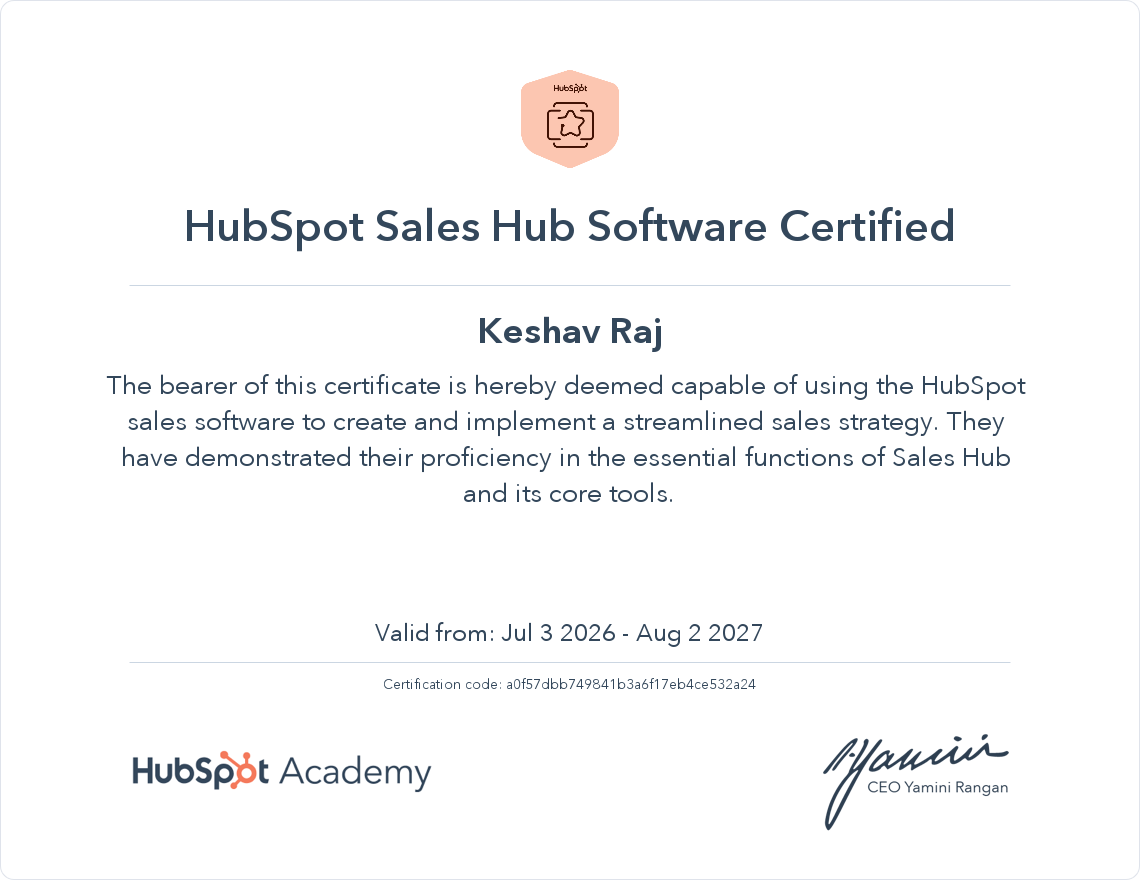
✓Reporting: Built campaign performance dashboards in Looker Studio and HubSpot so stakeholders could see results.
The foundation
Running campaigns and reporting on them taught me that a lead only counts if you can follow it all the way to pipeline.
SEOGoogle AdsLinkedIn AdsLooker StudioHubSpot
$206KAverage monthly pipeline from paid search and social, peaking at $619.5K in Feb 2022.
PROOF · FROM HUBSPOTCLICK TO ENLARGE
These reports run from Dec 2019 to Apr 2022. My role began in Aug 2020, so every number quoted here starts from Aug 2020.
CHAPTER 02Growth Marketing Manager · AptyJan 2023 – Jun 2024
From chasing clicks to reading buyer signals.
Next, the focus shifted from reaching more people to reaching the right accounts at the right time. I ran marketing operations and intent-driven programs, turning buyer signals into targeted campaigns and faster sales handoffs.
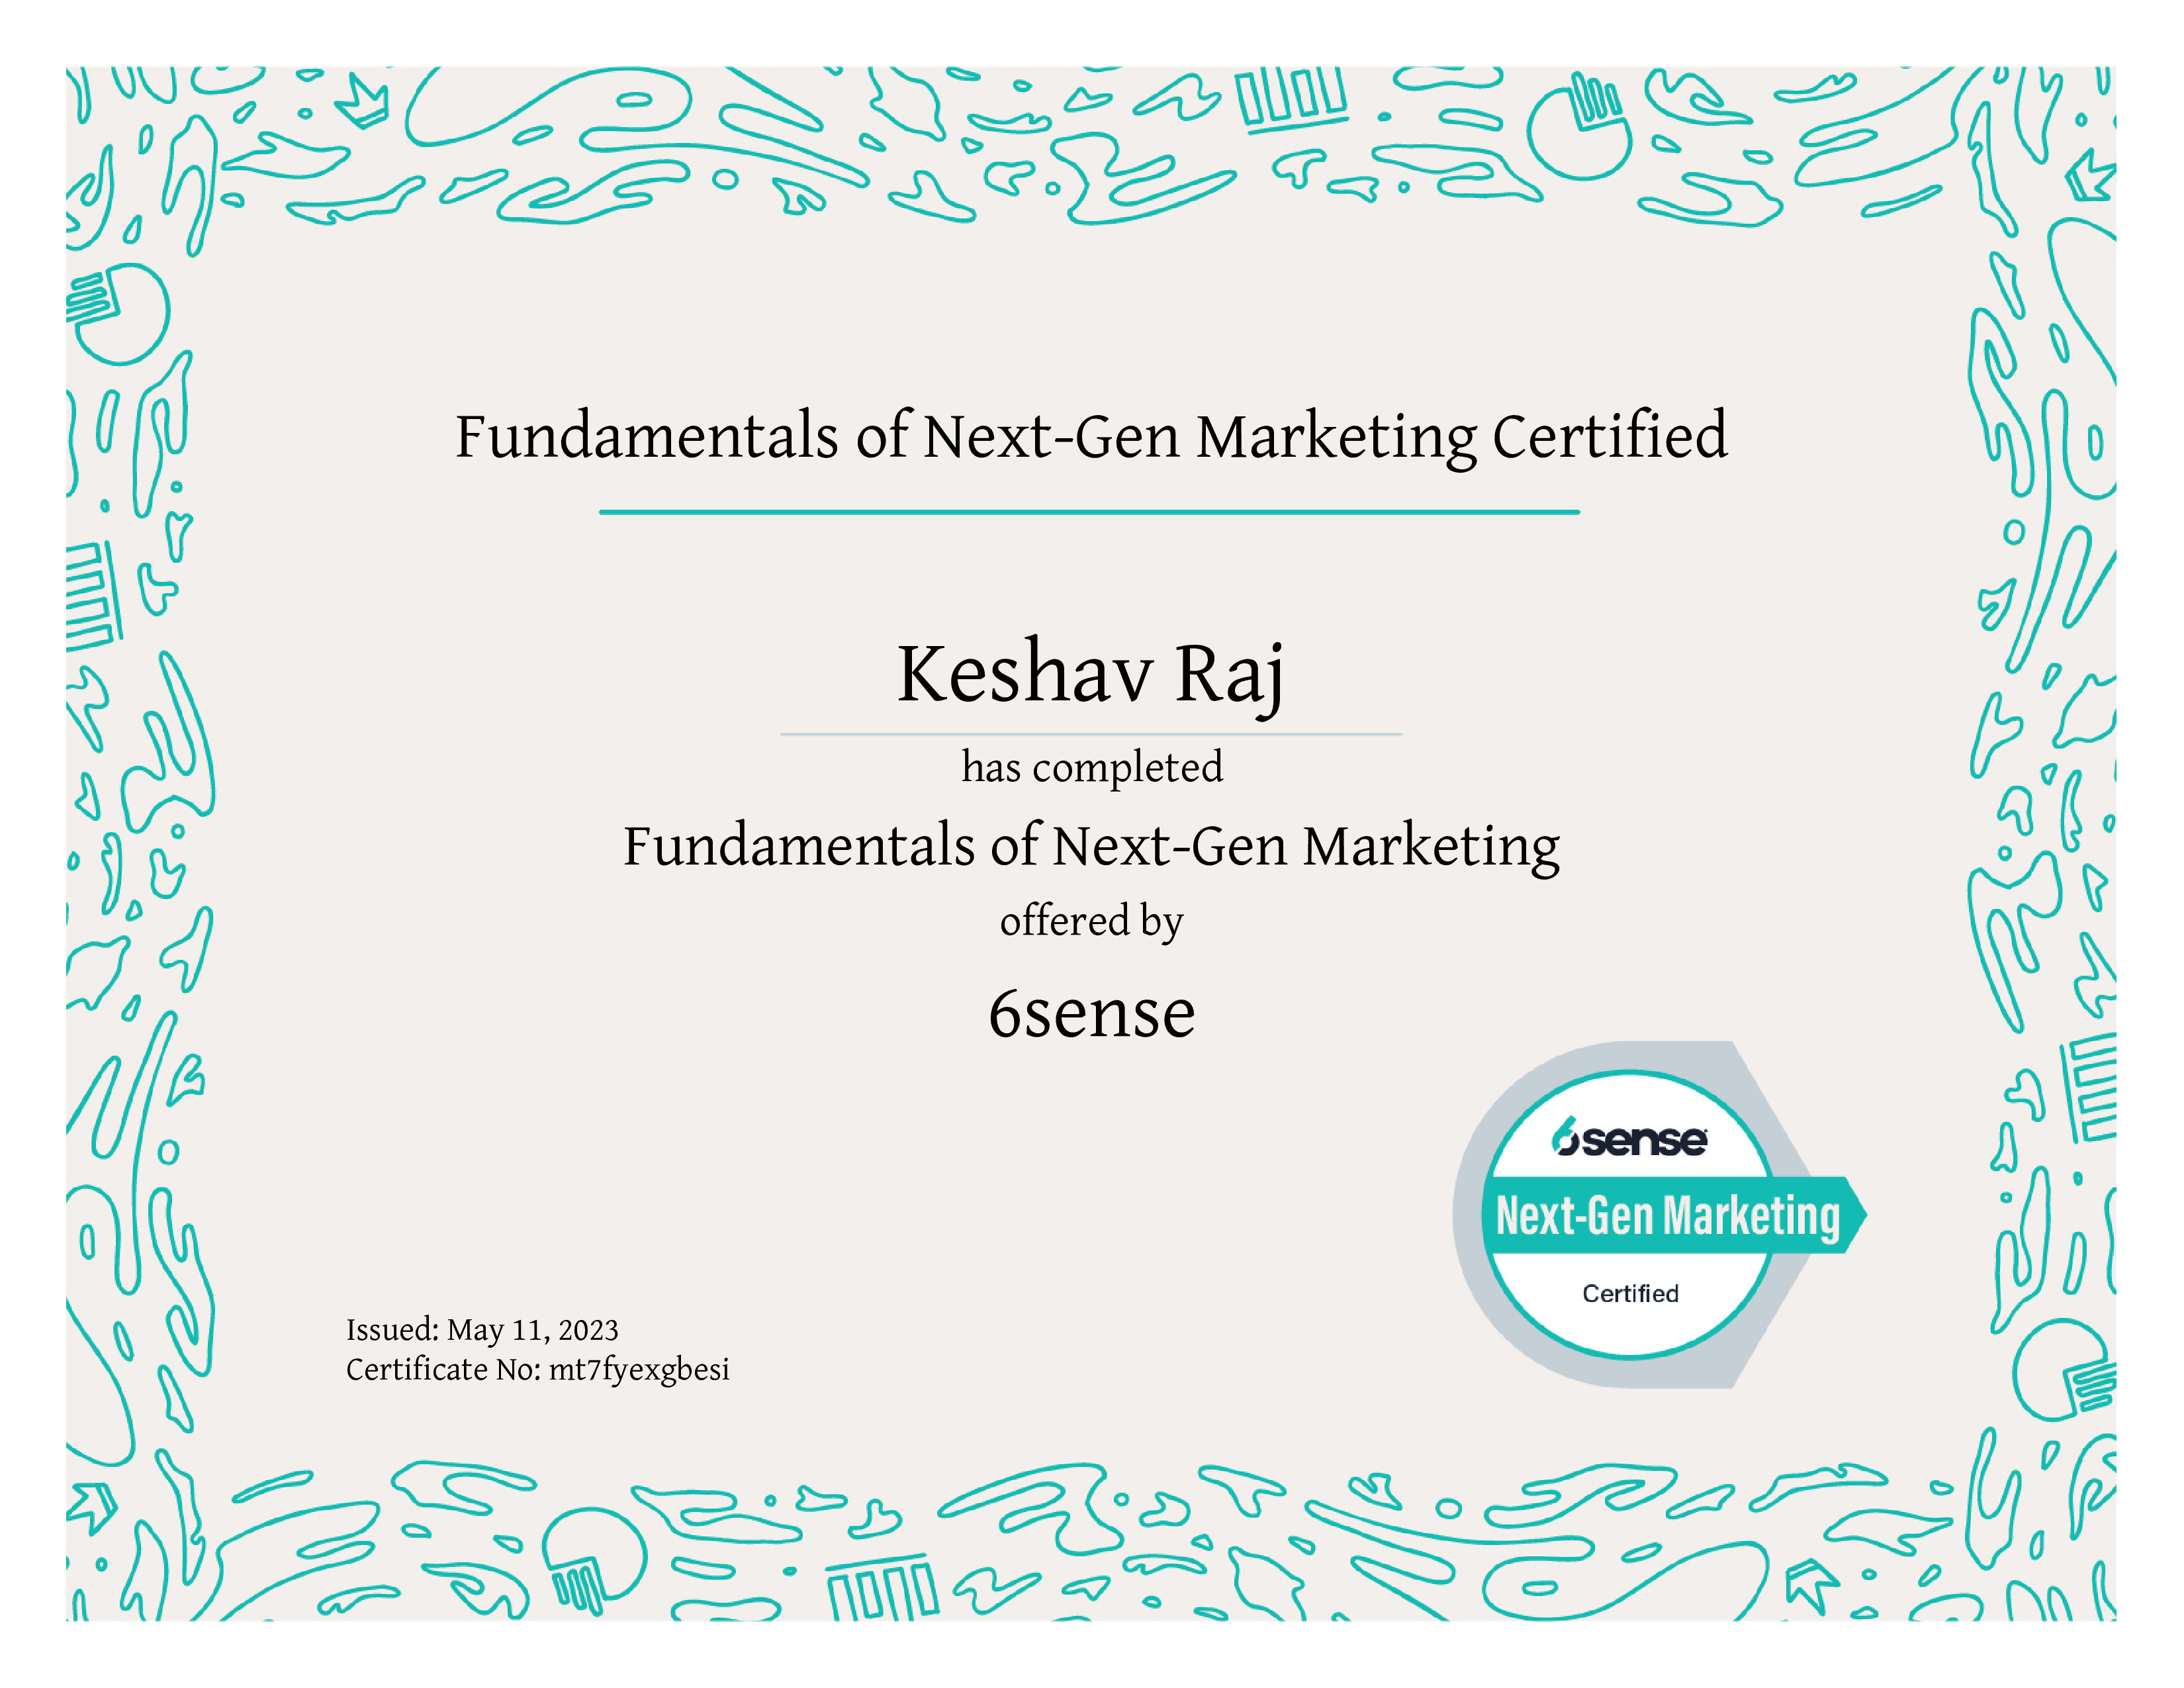
✓Intent data & segmentation: Brought together signals from 6sense, TechTarget Priority Engine, Warmly, RB2B, and G2 Buyer Intent to build dynamic segments of in-market accounts and act on them in real time.
✓Account-based marketing: Launched ABM plays aimed at high-intent accounts, with personalized journeys matched to each account’s buying stage.
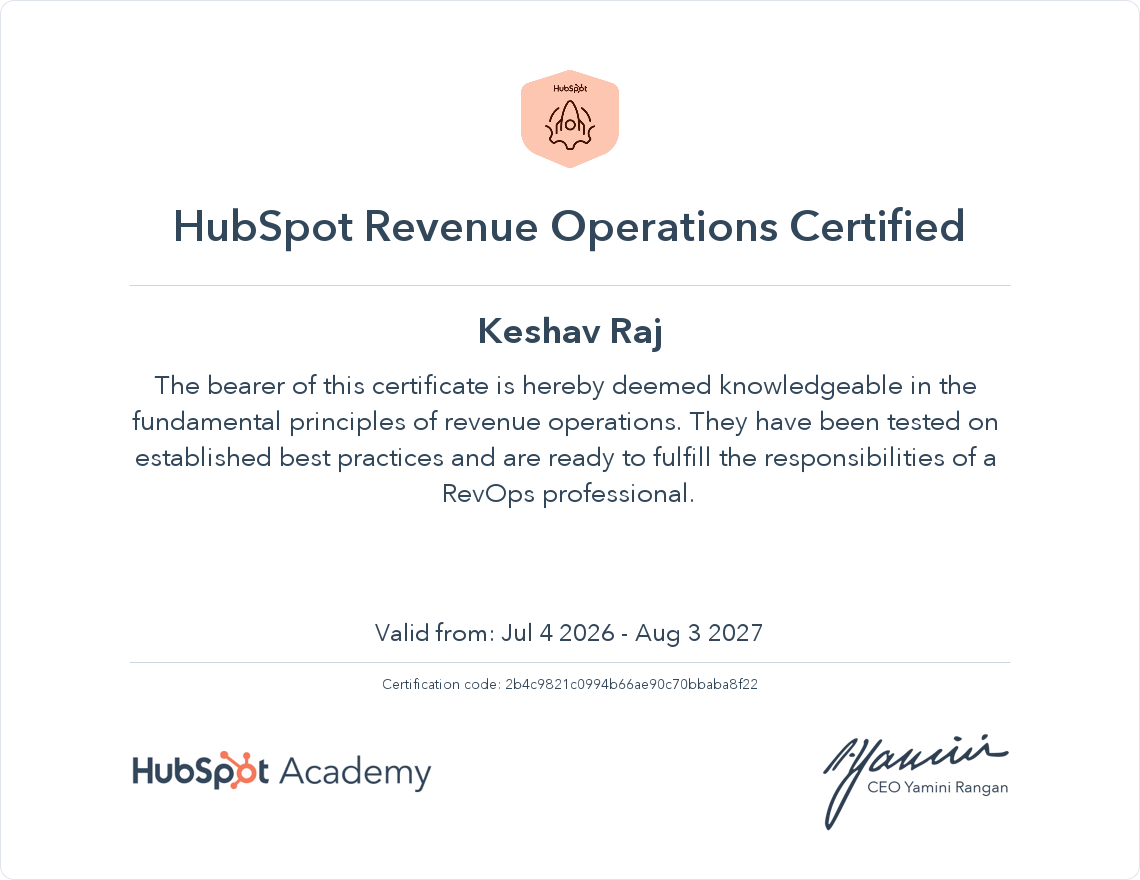
✓Signal-based handoffs: Built HubSpot workflows that routed leads to sales by buying signals, engagement score, lead source, and region (US & Canada, Europe, Middle East, Africa, APAC). Average time to first touch fell from 124 days in 2023 to under 7 days in 2024.
The shift
Instead of marketing to everyone, start with the accounts already showing they’re in market.
Then I took ownership of the whole go-to-market engine: who we target, what we say, the campaigns we run, and the systems that power them. The goal was to reach in-market buyers, shorten the path from first touch to pipeline, and give Marketing, Sales, and CS one source of truth.
✓Intent-driven ABM: Connected buying signals from 6sense, G2 Buyer Intent, and RB2B to HubSpot to surface in-market accounts and prioritize them for campaigns and sales follow-up.
✓Lifecycle & lead management: Built HubSpot from scratch, including custom objects, lifecycle stages, and lead scoring, so every lead had a clear owner and next step from MQL to SQL to opportunity. Lead conversion rate rose from 1.5% in 2023 to 9.8% in 2024.
✓Speed-to-lead: Set up automated enrichment and webhook-based handoffs that sent high-intent hand-raisers straight to sales in under 15 minutes.
✓Pipeline visibility & forecasting: Cleaned up deal stages, data rules, and forecast models, giving leadership full visibility into pipeline health and more predictable revenue. Average days to close fell 46% year over year, from 235 days in 2024 to 126 in 2025, and sales velocity grew from $1.2K in 2023 to $51.5K in 2025.
✓Multi-touch attribution: Launched dashboards that tied every marketing and outbound channel to pipeline, showing where budget drove revenue and where pipeline was leaking.
✓Funnel optimization: Found drop-off points across the customer lifecycle and replaced manual tasks with automated workflows, lifting stage-to-stage conversion rates.
The result
One connected engine, from the first buying signal to a forecast leadership could trust.
<15 minSpeed-to-lead for high-intent hand-raisers, through automated enrichment and handoffs.
1.5 → 9.8%Lead conversion rate, 2023 vs. 2024, after rebuilding lifecycle stages and lead scoring.
PROOF · FROM HUBSPOTCLICK TO ENLARGE
CHAPTER 04GTM Consultant · KrooloIN PARALLEL WITH APTYMar 2024 – Jun 2026
Building a go-to-market from zero.
At the same time, Kroolo gave me a different challenge: build the whole thing from scratch. The job was to bring paid acquisition, signal-based outbound, and full-funnel reporting together into one connected system.
✓HubSpot from zero to one: Set up Kroolo’s full HubSpot instance, including custom deal pipelines, PandaDoc quoting (CPQ) integration, and real-time revenue dashboards for leadership.
✓Signal-based outbound: Connected HubSpot with RB2B, Apollo, and Seamless.ai to turn anonymous website visitors into known accounts and route high-intent prospects straight to sales.
✓Paid acquisition & attribution: Set up conversion tracking and attribution for Google Ads and LinkedIn Ads, giving full-funnel visibility from first click to signed contract.
✓G2 intent capture: Optimized Kroolo’s G2 profile and set up intent triggers that turned bottom-of-funnel buyer activity into active sales pipeline.
✓SEO & content automation: Built n8n workflows to automate keyword research and data collection, cutting manual content ops time by more than 50%. Over 12 months, organic search grew to 105K clicks and 11.1M impressions.
✓Funnel analytics: Built full-funnel Looker Studio dashboards and ran weekly reviews to find drop-offs from signup to demo booked to closed-won.
The proof
Everything learned at Apty, rebuilt from a blank slate for a different company.
HubSpot EnterpriseRB2BApolloSeamless.aiG2 Buyer IntentGoogle AdsLinkedIn Adsn8nPandaDocLooker Studio
50%+Less time spent on manual content ops, through n8n automation.
PROOF · FROM GOOGLE SEARCH CONSOLECLICK TO ENLARGE
Along the way
Shorter engagements. Same playbook.
Not every project was a full go-to-market build. Some were about proving demand, some about driving sales, and one was about understanding a market before entering it. Each one started with the same question: what will actually move the numbers?
Google Ads ConsultantJan 2025 – Mar 2026
Turning ad spend into service sales.
Russian Cleaning Company
Grew revenue with performance-focused Google Ads, high-converting landing pages, and real-time dashboards to optimize results.
✓Planned, launched, and optimized campaigns across five services: regular, deep, office, move-in/move-out, and post-construction cleaning.
✓Designed and built conversion-focused landing pages in Wix to support each campaign and maximize leads.
✓Built a Looker Studio dashboard to track campaign KPIs, spot trends, and guide budget decisions.
Google Ads ConsultantFeb – Apr 2025
Testing real demand before scaling up.
Shan & Co.
Ran early-stage growth experiments to test product-market fit through targeted, performance-driven Google Ads.
✓Designed and ran campaigns to validate demand for Shan & Co.’s global business expansion document templates.
✓Generated measurable engagement within a 3-month testing window.
✓Analyzed campaign performance to assess traction and share insights on product-market fit.
Market ResearcherDec 2024
Mapping a market before entering it.
Joy PIM
A focused, one-month market research sprint designed to help shape how Joy PIM positioned itself in the PIM market.
✓Mapped the PIM market landscape, including key trends, opportunities, and adoption drivers.
✓Ran a competitive study to benchmark existing players on features, pricing models, and go-to-market strategy.
✓Delivered clear insights to guide product positioning, differentiation, and market entry.
Featured build
Project Aera: one view of growth leadership can trust.
Marketing data lived in one place, sales data in another, and leadership had to piece the story together. Aera brings it all into one real-time dashboard. It’s a unified internal BI platform that pulls fragmented Marketing and Sales data into a single, clear view of revenue performance.
What it delivers
✓Real-time view of core growth KPIs
✓Revenue and pipeline performance insights
✓Unified Marketing + Sales attribution
✓Clean visuals for executive reporting
Built with
✓Vercel for the frontend
✓GitHub for the backend workflow
✓Direct API integrations with GA4, Search Console, Google Ads, LinkedIn Ads, and HubSpot
AERA.SOURCES
GA4CONNECTED
Google Search ConsoleCONNECTED
Google AdsCONNECTED
LinkedIn AdsCONNECTED
HubSpotCONNECTED
↓
Aera · one dashboard
Growth KPIs
Pipeline & revenue
Unified attribution
Executive reporting
The throughline
Four pillars, built one role at a time.
Put the chapters together and a clear pattern shows up. Here’s where each part of the go-to-market comes from.
01
ICP & positioning
Deciding who to target and what to say, based on the accounts most likely to buy and the problems they’re solving.
Proven at: Apty, Joy PIM Work: ABM targeting, competitive study
02
Intent-driven plays
ABM and signal-based outbound programs that reach in-market accounts while they’re still deciding what to buy.
On a 30-minute call, we’ll dig into your current setup, pinpoint where opportunities are slipping away, and map out a roadmap to fix it. The roadmap and blueprint are free and yours to keep, whether or not we work together.